
Group Business Review
2019 Key Group Figures at a Glance
- Order intake totaled CHF 2 590 million versus CHF 2 731 million in 2018, a decrease of 5.2% due to weak markets.
- Order backlog decreased 2.2% to CHF 583 million versus CHF 596 million in 2018.
- Sales, impacted by adverse currency movements, decreased 0.6% to CHF 2 593 million from CHF 2 609 million in 2018.
- EBITDA, including exceptional items, was 9.9% lower to CHF 366 million, or 14.1% of sales, versus CHF 406 million, or 15.6% of sales, in 2018. EBITDA, excluding exceptional items related to restructuring, was 15.1%.
- The result from continuing operations decreased 36.4% to CHF 110 million from CHF 173 million in 2018.
- Net result, impacted by the reclassification of CHF 284 million related to the sale of the drive systems business, totaled CHF - 66 million, or earnings per share of CHF - 0.21. In 2018, net income was CHF 245 million, or earnings per share of CHF 0.71.
- Headcount (FTEs) totaled 11 134, compared with 10 727 employees worldwide in 2018.
- ROCE stood at 7.0%. In 2018, it was 12.1%.
- The Board of Directors will recommend a dividend payout of CHF 1.00 per share at the 2020 AGM. This comprises an ordinary dividend of CHF 0.35 and an extraordinary dividend of CHF 0.65 per share.
Sales 2019 by Segment
in CHF million
- Surface Solutions Segment
- Manmade Fibers Segment
EBITDA 2019 by Segment
in CHF million
- Surface Solutions Segment
- Manmade Fibers Segment
- Others
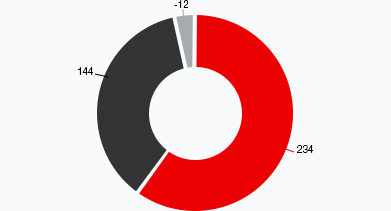
Sales 2019 by Region
in CHF million
- Europe
- Asia Pacific
- North America
- Other regions
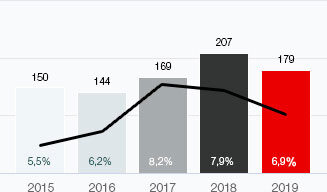
Capital expenditure
in CHF million
— In % of sales
- 2015
- 2016
- 2017
- 2018
- 2019
R&D Expenses by Segment
- Surface Solutions Segment
- Manmade Fibers Segment
Corporate Structure
Oerlikon is a leading global technology and engineering Group providing market-leading solutions and services for surfaces and manmade fiber production in diverse industries. Following the divestment of the Drive Systems Segment, the Group is structured in two segments: Surface Solutions and Manmade Fibers. Each segment offers technologies and solutions under well-established industry competence brands and adopts strategies specific to customers’ needs and requirements in the respective market.

Group 2019 Performance
Oerlikon delivered 2019 results around the same level as in 2018 despite the challenging market environment. These results underscore the strength of Oerlikon’s portfolio and business model. In a year beset by political uncertainties and ongoing disputes in global trade agreements, industries proceeded with caution. This understandable reticence did not change Oerlikon’s strategy or slow its technological advancements. Oerlikon continued to invest in its businesses and structural growth.
In 2019, Group order intake decreased by 5.2% to CHF 2 590 million (including a negative currency impact of 2.2%), compared with CHF 2 731 million in 2018, while order backlog decreased by 2.2% to CHF 583 million at year-end 2019 versus CHF 596 million at yearend 2018. Group sales was slightly lower by 0.6% in 2019 to CHF 2 593 million from CHF 2 609 million in 2018, mainly attributed to adverse currency movements. At constant exchange rates, sales were at CHF 2 650 million. The ratio of Group service sales to total Group sales remained the same at 38% in 2019 as in 2018.
Group EBITDA decreased 9.9% to CHF 366 million, yielding a margin of 14.1%. This compares to Group EBITDA of CHF 406 million and a margin of 15.6% in 2018. Group EBITDA in 2019 was impacted by exceptional items, mainly for restructuring, in 2019. Excluding these expenses, Group EBITDA for 2019 was 15.1%. Group EBIT stood at CHF 164 million, or 6.3% of sales in 2019 while in 2018 EBIT was CHF 243 million, or 9.3% of sales.
The Oerlikon Group income from continuing operations in 2019 was CHF 110 million, compared with CHF 173 million in 2018, a decrease of 36.4%. After including net results of discontinued operations of CHF -176 million in 2019, net income amounted to CHF -66 million in 2019, or earnings per share of CHF -0.21, versus CHF 245 million or earnings per share of CHF 0.71 in 2018. The tax expense for 2019 was CHF 39 million, while in 2018, it was CHF 68 million.
A globally balanced business
Maintaining a portfolio of innovative technologies, a global presence and industry-leading scope of comprehensive services continue to be key components of Oerlikon’s growth strategy. The Surface Solutions Segment contributed 57% to total Group sales in 2019, while the Manmade Fibers Segment accounted for approximately 43% of Group sales.
With a strong global footprint, Oerlikon operates over 182 sites in 37 countries, with 83 sites in Europe, 54 sites in Asia-Pacific and 45 sites in the Americas. Asia-Pacific continued to account for the largest proportion of Group sales in 2019. Sales in Asia-Pacific remained stable, amounting to CHF 1 203 million, or 46% of Group sales, versus CHF 1210 million, or 46% of Group sales, in 2018. Europe was the second largest regional contributor to Group sales in 2019, with sales totaling CHF 897 million, or 35% of sales, compared with CHF 852 million, or 33% of sales, in 2018.
Group sales in North America totaled CHF 394 million, or 15% of Group sales, in 2019, versus CHF 409 million, or 16% of Group sales, in 2018. Sales in other regions decreased slightly to 4% of Group sales in 2019 with sales of CHF 99 million, compared to CHF 139 million in 2018.
Solid balance sheet strength with equity ratio of 48%
As of December 31, 2019, Oerlikon’s balance sheet totaled CHF 3 647 million, compared to CHF 4 545 million at year-end 2018. The Oerlikon Group had equity (attributable to shareholders of the parent) of CHF 1 756 million, representing an equity ratio of 48%, compared to CHF 2 001 million, or an equity ratio of 44% as at December 31, 2018. The decrease in total balance sheet is attributed to lower cash and cash equivalent positions and reduced current financial investments and derivatives as a result of the payout of dividends and the redemption of a matured bond in 2019. Total liabilities in 2019 decreased mainly due to the liabilities classified as held for sale in 2018 was no longer valid. As a result, net liquidity at the end of 2019 was slightly lower at CHF 333 million compared to CHF 398 million at 31 December 2018.
Healthy operating cash flow
Cash flow from operating activities before changes in net current assets decreased 24.9% in 2019 to CHF 322 million, compared with CHF 429 million in 2018. Net working capital, defined as trade and trade note receivables plus inventories minus trade payables and current customer advances, totaled CHF -70 million in 2019 versus CHF -79 million in 2018.
Capital expenditure (CAPEX) amounted to CHF 179 million, compared to CHF 207 million in 2018. Excluding amortization of acquired intangible assets, the CAPEX to- depreciation ratio was 1.42 times, which is higher than the Group’s target of between 1.0 to 1.2 times due to significant investments in additive manufacturing and in building up surface solutions businesses such as ePD and CVD.
Cash flow from investing activities was CHF 416 million in 2019, compared with CHF -342 million in 2018, attributable primarily to the sale of the Drive Systems Segment. Cash flow from financing activities amounted to CHF -760 million in 2019, mainly for dividend payments of CHF 343 million, purchase of treasury shares of CHF 64 million, repayment of financial debt of CHF 336 million and interest paid of CHF 17 million, compared with CHF -149 million in 2018, which included dividend payments of CHF 118 million, purchase of treasury shares of CHF 14 million, repayment of financial debt of CHF 5 million and interest paid of CHF 16 million. Oerlikon reported a cash and cash-equivalent position at the end of 2019 of CHF 658 million compared with CHF 858 million at the end of 2018.
Commitment to R&D
Oerlikon continued to invest more than 4% of its revenues in research and development (R&D). In 2019, R&D expenses for the year was CHF 127 million, or 4.9% of Group sales, compared with CHF 120 million, or 4.6% of Group sales, in 2018.
Acquisitions and Divestitures
To further strengthen its expertise and product offerings to its customers, the Surface Solutions Segment completed three acquisitions in 2019. At the end of the first quarter, the acquisition of TeroLab Surface GmbH in Langenfeld, Germany was closed to expand the Surface Solutions Segment’s portfolio of thermal spray coating services for industries like agriculture, steel and automotive as well as to machine OEMs. In the third quarter, Oerlikon acquired AMT AG in Switzerland to extend its product and service offerings for thermal spray applications and turnkey solutions. Toward the end of 2019, Oerlikon acquired D-Coat GmbH in Germany to widen Oerlikon Balzers’ thin-film coating portfolio, particularly for cutting tools used in the aerospace and automotive industries. At the end of February 2019, the divestiture of the Drive Systems Segment to Dana Inc. was completed.
Dividend Payout
Oerlikon believes that a dividend payout is an important means of returning value to shareholders. As an efficient use of our current cash position and capital, the Board of Directors will recommend a dividend payout of CHF 1.00 per share at the 47th Annual General Meeting of Shareholders on April 7, 2020. The proposed dividend comprises an ordinary dividend consistent with the previous two years of CHF 0.35 and an extraordinary dividend of CHF 0.65 per share.
